Operational dashboards
Show what is waiting, moving, blocked, overdue, or ready for review without asking staff to rebuild the picture manually.
Reporting And Dashboards
Restech builds reporting views, dashboards, workflow queues, management summaries, and exports into the systems it develops, so teams can see what needs attention and act on it.
What It Means
Reporting is useful when it helps someone decide what to do next: which documents need review, which jobs are stuck, which bookings need attention, which records are missing, or which part of the operation is creating repeat work.
Restech usually builds reporting into operational systems rather than treating it as a separate dashboard project. That keeps the reporting close to the records, permissions, workflow states, and staff screens that already shape the work.
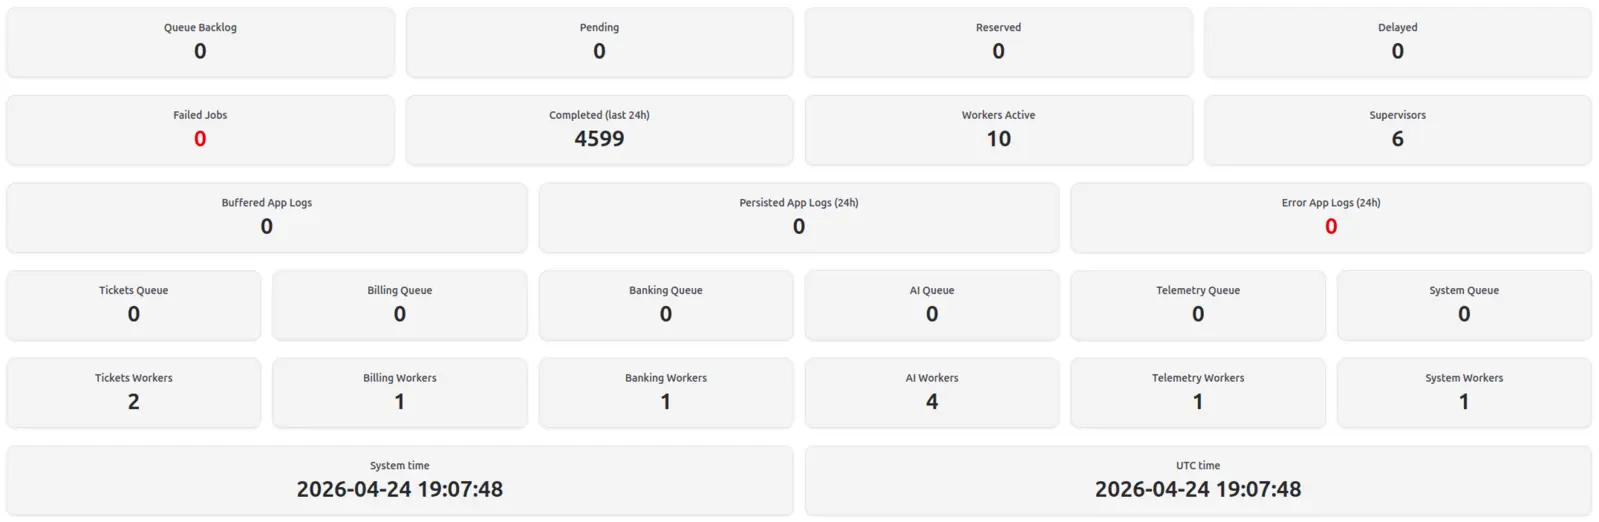
Dashboard Proof
Useful dashboards bring the important signals together so teams can spot backlog, failures, worker health, and other operating conditions quickly.
Dashboard Shapes
The best reporting surfaces are usually close to the workflow, not a separate layer nobody trusts.
Show what is waiting, moving, blocked, overdue, or ready for review without asking staff to rebuild the picture manually.
Turn records into practical worklists so teams can see exceptions, approvals, missing details, and next actions.
Surface the financial or admin state that matters to the workflow, while keeping source records and permissions clear.
Give managers a dependable overview of activity, status, and trends without needing another spreadsheet ritual.
Make customer, service, booking, document, or equipment records easier to filter, understand, and act on.
Provide exportable data where another system, accountant, supplier, or internal process still needs a controlled file.
Build Principles
A dashboard can only be as dependable as the workflow behind it. If the data is incomplete or the process is unclear, the first job is often to fix the records and review points.
Operational Decision Making
Dashboards should reduce the time spent asking "where are we up to?" and increase the time spent dealing with the right work. That may mean a chart, but it may also mean a filter, export, exception queue, or small summary panel.
The aim is not to cover every possible metric. It is to give each role enough visibility to make better operational decisions without digging through inboxes, spreadsheets, or raw records.
Proof
The proof is practical: clearer records, staff views, customer access, booking visibility, and operations that are easier to inspect.
Related Services
Reporting works best when it is connected to the records, workflows, and integrations that create the data.
Start with the decisions your team keeps making from spreadsheets, inboxes, or memory. That usually shows which reporting view is worth building first.